

Jen caught up with Ella Austin (BomBella Designs), colourwork toy designer extraordinaire, recently to find out all about her inspiration and process of design.
Read moreDrawing knitwear schematics in Illustrator: Part 3
Today's post covers refining your outline shape - adding curves and details - as well as adding measurements and aligning. This completes the series on using Illustrator to draw knitwear schematics. The first two posts in this series covered setting up preferences and layers in Illustrator, and drawing basic outline shapes.
This is the basic angular outline shape for our schematic. It is the schematic for the Droplet Bolero from A Stitch in Time 2 (which should be landing on my doormat some time today or tomorrow - squeal!).

In order to add curves to the shape, we will convert some of the anchor points. So for example, at the bottom right of the diagram, we want to introduce a curve after the welt. Select the outline using the black Selection Tool, and then choose the Convert Anchor Point tool. This will be found underneath the Add Anchor Point tool that you used earlier (click and hold on the fountain pen icon to see the other options).

You then click on the point where you want to introduce a curve, and drag a handle out a little way from the point. Don't be alarmed when your lines look like they have "gone wrong", this is normal.
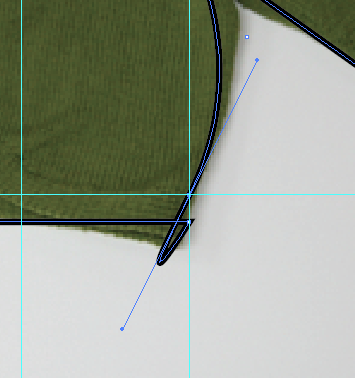
Curves are added using a Bézier tool. This is particularly brilliant, because it means that your image can be scaled as large as you wish, without pixellating. The curve is controlled at each side of the anchor point, using the two handles (shown with small blue circles in the image above).
Get a feel for how the handles control the curve by using the white Direct Selection Tool to move the handles round. Try moving them further away from the anchor point, following the same direction, and see how this changes the curve.
We only want a curve on the upper side of the anchor point, so we will first of all remove the handle on the lower side. You do this by simply picking up that lower handle, using the white Direct Selection arrow, and drag the handle back onto the anchor point. You should "feel" it snap away. Drop it there, and you will now only have a handle (and thus a curve) on the upper side of the point.

Adjust the remaining handle until you are happy with the shape of the outline. Repeat this process at all the points where you require curves. You can use guides as before to ensure that the curves are the same on both sides of the outline. Just snap the handles to guide points.
Now that the outline is complete, lock the outline layer, and unlock the detail on outline layer.
Add lines to your drawing to show details such as front openings, armhole shape, pockets etc... Use the Line Segment Tool, and set the stroke properties in the same way that you did for the outline shape.
Convert anchor points to add curves to the detail lines as you wish.
If you want to add two elements that look identical, but are mirror images of each other, then you can use the reflect tool.

Select the item you wish to reflect, using the black Selection Tool. Then go into the Object menu and choose Transform... From the submenu, you can then pick Reflect...
Choose whether you want to reflect it horizontally or vertically, and then rather than hitting OK, choose copy. This creates another object, rather than transforming the selected object.

Then simply move the new front edge line into place, using the arrow keys.

Add any other details, that you require, to the outline drawing. Then lock the detail on outline layer and unlock the outline layer.

Select the outline shape and making sure that the fill toggle is to the front, add a white fill to the basic shape.
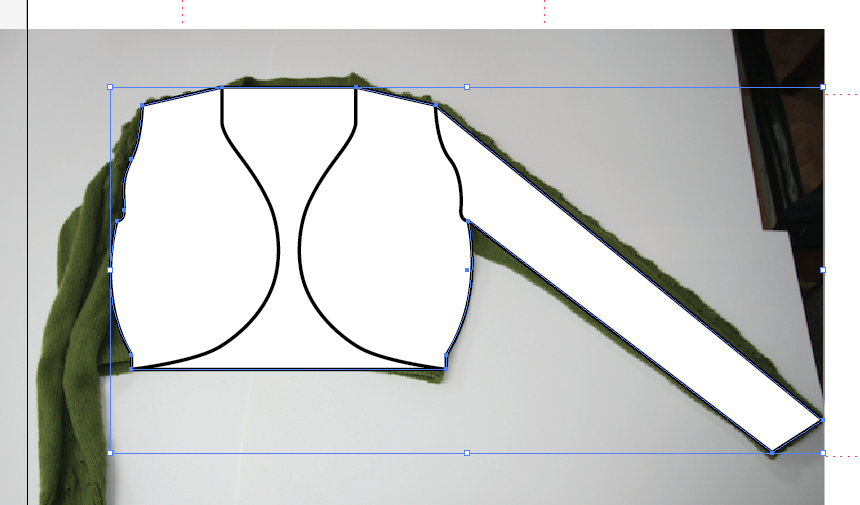
If you are happy with the shape, then lock the outline layer and unlock the scan layer. You can now delete the photograph out of your file. Then relock the scan layer, and unlock the measurements layer, as it's time to add some arrows to the diagram.

Arrows are added very simply as lines using the line segment tool. If you hold down shift while drawing the line, it will automatically be either horizontal, vertical or on a 45 degree angle.
Once you have added the line, you can use the Stroke palette to choose its properties - thickness, shape of arrowheads and so on.

At this point it may be helpful to make the guides visible again (select Show Guides from the View menu, and Guides submenu). Be sure to use the white direct selection arrow to change the length or position of the ends of your arrows, or you will stretch them, thus making the lines different thicknesses.

Unlock the text layer, and use the Type Tool to start a text box. Simply type your measurements into the box, then choose the font and size from the Character palette.
To make your text align nicely with the arrows, you will need to choose which object is the Key Object. Once you have selected a Key Object, it doesn't move, and the other object must move to align with the Key.
Select two objects using the black selection arrow.

Then hover over the item you want to align to (in this case it's the arrow which has been carefully placed to line up with the shoulders) until you see the black arrowhead, and click on the arrow again. If you have done this correctly, the arrow (or your Key Object) will have a thick highlight over it.

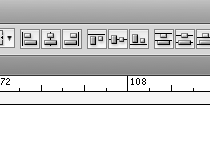
Now choose how you want the text and arrow aligned, and only the text will move. I want these horizontally centre aligned, so I click on the icon which shows the objects in that formation (second from left in the picture below).
Repeat the process, adding measurements and arrows as necessary to your diagram.
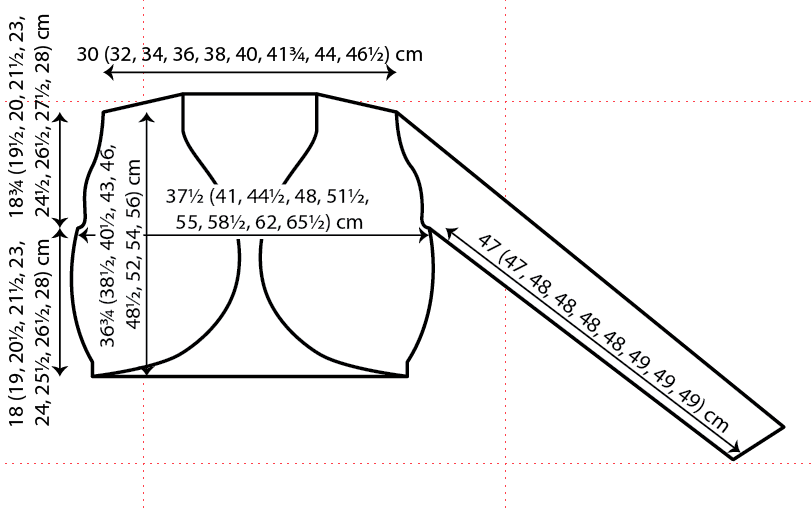
Once you are happy with your finished diagram, be sure to lock all of the layers, and make sure that they are all set to be visible.

You can then choose to output your diagram in a wide range of formats. If you are working on an InDesign file for your pattern, the Illustrator file can be placed straight into it. Alternatively, you can choose from png/pdf/tif/jpeg/windows meta file and many other formats for your finished schematic.

Please don't hesitate to leave a comment if you have any questions. I hope that this series has been useful.
Jen x
Drawing knitwear schematics in Illustrator: Part 1
One of the many jobs that I've done while working on A Stitch in Time 2 is drawing schematics for each of the garments. I thought it might be helpful to do a quick run-down on drawing these, as it seems to be a question that pops up from time to time on designer blogs and in the designer's group on Ravelry. I am using Adobe ® Creative Suite 5 ® (CS5) and my copy of Illustrator ® is version 15.0.0. I work on a MacBook Pro using OS X version 10.6.8. Some aspects may look a little different if you are using a PC or an older version of Illustrator, however the differences shouldn't be too significant.
This tutorial will be split into 3 posts. This post deals with getting your work space set up. The next post will be published next week, and will cover drawing your outline shapes in Illustrator. And the final post will cover adding curves, alignment and adding measurements.
The first job is to get your Preferences set up correctly. In the Illustrator menu at the top left of your screen you will see Preferences, hover over it and then choose General from the menu. Clicking on General gives you the following dialogue box of general preferences:

For drawing charts and schematics for knitting patterns, you won't need to use most of the possible settings on Illustrator. The first choice is your keyboard increment. This determines how far things move when you use the up, down, left and right arrows on your keyboard. For drawing schematics, I usually have this set to 1 pt. Choose your increment, but don't hit the OK button just yet.

Use the drop-down menu at the top of the dialogue box to select the Units screen. Then make sure that all units are set to Points (of course if you would rather work in inches or millimetres or pixels, then do - just make sure that you have your keyboard increment set to a sensible value for your units). Again, don't click OK just yet, simply select the Guides and Grid screen.

I generally work with a dot style of grid, and gridlines every 100 pt with 100 subdivisions between them. This means if I am snapping things to my grid, I have good control over where shapes are going. For drawing charts, then 10 subdivisions is probably plenty (each subdivision will be 10 pt apart rather than 1 pt that I use for schematics). Go wild with your colour choices, but it's probably worth choosing a colour that you won't be using in your schematic or charts.
Having set up your Preferences, you can open a document. When you choose New... you will be asked for a document name and the size of your Artboard (the area on which you will be drawing). I've named this Sample and chosen A4 size.

If you aren't seeing the red gridlines you may need to choose Show Grid from the View menu.
The next step is to set up some layers to work on. I imagine these like sheets of tracing paper. They determine what shows up in your final image and you can move layers up and down like sheets of tracing paper in a stack. Things at the bottom of the stack may be covered up by the layers above. But they are more useful than that, because you can lock one or more layers while you work on others. So once your outline is finished you can lock it so that you don't mistakenly move things round while you are drawing arrows or something else. In fact, you can even make layers invisible for a while too, if that's useful.
I have my layers palette set up at the bottom of the options on the right of my screen. It's the button that looks like layers! If you can't see it, then you can choose Layers from the Window menu at the top. This will give you a Layers dialogue box that you can drag and drop over to the right of the screen.
You will automatically have one layer already. To add more, simply click on the little button at the top right of the Layers palette. It looks like 4 horizontal lines with a small downward pointing triangle to the left of the lines (on any of the palettes, this will give you more options). This gives you the layers options menu.

From this menu, you can choose to rename the current layer by going into the Options for "Layer 1"... dialogue box. You can also add new layers.
This is the dialogue box you get when you choose Add new layer...

Choose a name for your layer and click on OK.
I would suggest that for drawing schematics, it is useful to set up layers as follows:

There are 8 different layers and I've named them to give an idea of what I would use that layer for. You can move layers around by dragging and dropping them in your desired order. The eye symbols on the left show that all of these layers will be visible. If you click on the eye that layer will no longer be visible (and won't print out either). Next to the eyes are the padlocks. These determine whether a layer is locked or not. When it's locked you can't do anything in that layer. You can't even paste an item into the layer. The coloured strips next to the padlocks show you what colour the things in that layer will show up as when they are selected (this is just the boxes and handles round items that you use to move, resize and manipulate them, not the actual things you are drawing).
In the picture above you will see that the Scan layer is highlighted in blue. If that layer was unlocked, it would be the active layer, or the layer I was drawing in. If you have multiple layers open, then the blue highlight shows which you will be editing or drawing in. You can change the active layer by simply clicking on the layer you wish to be active.
You are now ready to start drawing things, so do come back next week for basic steps in drawing outline schematics in Illustrator.